Unlock Free Frames: How to Overclock Monitor Refresh Rate
The pursuit of zero-latency visual output is a cornerstone of display engineering. To overclock a monitor’s refresh rate is to fundamentally manipulate the digital handshake between a graphics processor and a display panel. You are pushing the hardware to render frames faster than its factory certification dictates.
Most panels arrive on the consumer market intentionally hobbled. Factory spec is a suggestion. Frankly, it is a highly conservative, legally mandated suggestion designed to minimize warranty claims and facilitate artificial market segmentation.
A display sold as a 60Hz office peripheral often contains the exact same underlying silicon scaler as a 75Hz gaming panel. By bypassing the timing controller’s artificial restrictions, substantial performance gains are unlocked at zero monetary cost.
What is Refresh Rate? The Foundational Basics
At its most fundamental level, refresh rate dictates exactly how many times per second your display redraws the entire image on the screen. It is measured in Hertz (Hz). A standard 60Hz monitor physically paints a completely new picture 60 times every single second.
Think of it as the visual heartbeat of your system. Higher refresh rates translate directly to smoother motion tracking, drastically reduced visual blurring, and a tighter, more immediate connection between your physical mouse inputs and the on-screen render.
What is the Refresh Rate Number on a Monitor and How is it Calculated?
To successfully execute an overclock, the foundational mathematics governing display interfaces must be understood. The refresh rate number on a monitor is not an arbitrary label slapped on a retail box. It is a rigid mathematical derivative.
Manufacturers do not simply code a panel to run at a flat frequency. They engineer the hardware to support a specific Pixel Clock (often denoted as DOTCLK or DCLK). This clock defines the absolute speed at which pixel data is transmitted from the source controller (GPU or MCU) to the LCD module.
The refresh rate is derived by dividing this Pixel Clock by the total geometric rendering area of a single frame. When calculating the total pixels processed by the display logic, engineers must look beyond the active visible resolution. The total geometry includes non-visible timing intervals known as the blanking periods or porches.
The specific engineering formula used in display driver design is:
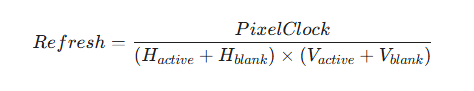
Consider the real-world application of a standard 7.0-inch TFT panel with an active visible resolution of 1024×600. Datasheets reveal the horizontal blanking (H_blank) is 32 pixels, and the vertical blanking (V_blank) is 23 lines. The total frame geometry becomes 1056 × 623, totaling 657,888 pixels per frame.
To achieve a baseline 60Hz refresh rate, the total pixels are multiplied by 60, resulting in a required Pixel Clock of approximately 39.47 MHz. If a user attempts to force this panel to 75Hz without adjusting the blanking intervals, the required Pixel Clock spikes to 49.34 MHz. If the monitor’s internal scaler is physically capped at a 45 MHz DOTCLK tolerance, the overclock will catastrophically fail, resulting in a black screen.
The Science / Research Insight: The Pixel Clock (DOTCLK) represents the continuous heartbeat of the display interface. According to NXP and Silicon Labs engineering whitepapers, DOTCLK runs perpetually, feeding data into the timing controller and triggering VSYNC and HSYNC states on rising edges. The absolute hardware ceiling of a display is reached precisely when the DOTCLK exceeds the maximum frequency tolerance of the internal logic board, resulting in catastrophic signal failure. Reference: 1, 2, 3
What Is Monitor Overclocking in the First Place?
At its core, monitor overclocking is the precise alteration of the Extended Display Identification Data (EDID). It can also involve the injection of a custom signaling profile from the host operating system. This forces the display hardware to operate at a higher frequency than the manufacturer’s official specifications.
The display industry relies heavily on artificial driver limits. A manufacturer produces a massive batch of LCD matrices and Timing Controllers (TCON). To fill different price brackets across global markets, the exact same hardware is programmed with different EDID ROM limits.
The host GPU interrogates this 256-byte ROM chip upon connection, reads the maximum allowable refresh rate, and restricts the user interface accordingly. Overclocking strips away this software barrier, forcing the host GPU to send an accelerated Pixel Clock to expose the true physical limit of the silicon.
Understanding the Mechanics
The mechanics of display tuning differ completely from CPU or GPU modifications. Processors contain their own complex logic units and phase-locked loop (PLL) clock generators that scale dynamically with voltage delivery. Monitors do not function this way.
A standard monitor is essentially a passive receiver interpreting a packetized data stream. Overclocking relies entirely on manipulating the host graphics card to send a faster DOTCLK. You must dynamically adjust the non-visible blanking intervals so the monitor’s Timing Controller (TCON) can still parse the incoming signal without dropping the link or corrupting the matrix transition.
Why Do You Overclock a Monitor?
The justification for pushing display hardware is rooted in practical efficiency and extracting maximum architectural overhead. Why pay a premium for a minor hardware revision when the existing peripheral has untapped overhead sitting dormant on the desk?
- Free Visual Smoothness: Gaining extra frames per second natively without upgrading the physical panel or logic board.
- Extending Hardware Relevance: Delaying the purchase of a new monitor by bridging the temporal gap between legacy 60Hz operation and modern high-refresh standards.
- Maximizing GPU Utility: A high-end graphics processor rendering 120 FPS is severely bottlenecked by a 60Hz display. Overclocking widens the visual pipeline to actually render the frames the GPU is already expending electrical energy to generate.
In professional testing rigs, stock 60Hz panels routinely pushed to 72Hz or 75Hz demonstrate a tangible 25% increase in temporal resolution. This dramatically improves cursor tracking, motion clarity during rapid panning, and scrolling text legibility without requiring a financial investment.
When Should You Overclock Your Monitor?
Not all hardware combinations are suitable candidates for aggressive timing adjustments. Pushing the refresh rate requires assessing the specific architectural overhead of the panel and the thermal capacity of the internal electronics.
| Scenario | Verdict | Engineering Reality |
| 60Hz Office Panel to 75Hz | Ideal | Standard 60Hz panels use scaler logic natively designed to handle 75Hz for legacy VESA compatibility. The architectural overhead is almost universally present. |
| 144Hz Gaming Panel to 165Hz | Marginal | High-refresh panels are heavily binned near their absolute silicon limits. Pushing a 144Hz TCON often saturates the scaler, leading to immediate frame dropping. |
| Laptop Internal Display (eDP) | High Risk | Laptop embedded DisplayPort (eDP) connections often lack standalone scaling processors. They rely directly on the GPU, and thermal tolerances within the laptop chassis are incredibly tight. |
Real-world thresholds exist where pushing the refresh rate risks system instability. When the DOTCLK exceeds the TCON’s mathematical tolerance, the display matrix cannot transition the liquid crystals fast enough. This results in severe image artifacts, color inversion, temporal smearing, or a complete loss of signal triggering a permanent black screen.
How Does Overclocking a Monitor Affect Gaming?
The temporal advantages in competitive gaming environments are measurable in precise milliseconds. Overclocking directly reduces the frame time—the absolute duration a single frame is held on screen by the liquid crystal matrix.
A baseline 60Hz refresh rate holds a frame for 16.67ms. Overclocking that exact same hardware to 75Hz reduces the persistence to 13.33ms. This 3.34ms reduction physically lowers system input lag.
The temporal pipeline between a physical mouse click, the GPU render queue, and the resulting on-screen action is entirely truncated. Furthermore, higher refresh rates inherently mitigate screen tearing.
Screen tearing is a visual artifact that occurs when the GPU pushes a newly rendered frame while the monitor is still actively drawing the previous one. By accelerating the display’s drawing cycle and lowering the frame time, the temporal window for tearing overlaps is minimized. When paired with Adaptive Sync technologies, a higher refresh ceiling allows variable refresh ranges (VRR) to operate over a much wider frequency band, keeping gameplay consistently synchronized even during heavy rendering loads.
Feasibility & Architecture: Can You Overclock Monitor Refresh Rate?
The core question of feasibility depends entirely on the scaler bypass logic and the specific Display Timing Controller (TCON) utilized by the manufacturer.
Historically, certain panels achieved legendary status within the overclocking community due to their complete lack of internal scalers. The infamous QNIX Q2710, a 1440p monitor dominant around the 2013-2015 era, featured a direct Dual-Link DVI connection that bypassed scaler logic completely.
Because there was no internal TCON attempting to process, color-correct, and scale the image, the panel accepted raw pixel data directly from the graphics card. Exhaustive testing revealed that these native 60Hz panels could routinely be pushed to 100Hz or even 120Hz purely because the bottleneck of the logic board was physically removed from the equation.
Modern panels, however, are predominantly “hard-locked” by design. They contain advanced TCONs that manage pixel Overdrive (OD), dynamic contrast ratios, local dimming algorithms, and complex color space mapping. If the incoming DOTCLK exceeds the rigidly programmed firmware limit of the logic board, the scaler simply rejects the signal and throws an “Out of Range” exception, regardless of what the actual liquid crystal matrix could theoretically transition.
The Science of Pixel Clocks and VESA CVT-RB
To successfully circumvent these TCON locks, engineers manipulate the non-active blanking intervals. Legacy CRT displays required massive blanking intervals—periods where absolutely no pixel data was transmitted—to allow the physical electron beam time to reset and return to the opposite side of the screen.
Modern LCDs and OLEDs do not rely on electron beams. Retaining these legacy CRT blanking intervals on a modern display wastes massive amounts of interface bandwidth.
The Video Electronics Standards Association (VESA) introduced Coordinated Video Timings with Reduced Blanking (CVT-RB) to address this gross inefficiency. By drastically shrinking the horizontal and vertical blanking periods, the total geometric area of the frame is reduced. Consequently, the required Pixel Clock drops significantly, allowing higher refresh rates to be transmitted within the exact same bandwidth limits.
| Video Format | Standard CVT Data Rate | CVT-RB v2 Data Rate | CVT-RB v3 Data Rate |
| 2560 × 1440 @ 60 Hz | 7.49 Gbit/s | ~5.80 Gbit/s | 5.58 Gbit/s |
| 3840 × 2160 @ 60 Hz | 17.10 Gbit/s | ~13.00 Gbit/s | 12.42 Gbit/s |
| 7680 × 4320 @ 60 Hz | 69.42 Gbit/s | 49.50 Gbit/s | 49.18 Gbit/s |
The CEA-861-H specification formally introduced RBv3, which defines highly optimized formulae for specifying different VBLANK and HBLANK durations. By forcing a monitor to utilize CVT-RB v3 timings, overall bandwidth overhead drops by nearly 28%.
This mathematical reduction artificially lowers the DOTCLK frequency below the TCON’s hard-lock rejection threshold. It opens the door to substantial overclocks without hitting cable or scaler bandwidth walls.
The Science / Research Insight: According to VESA CVT 1.2 specifications and Synopsys engineering whitepapers, Reduced Blanking Version 2 (CVT-RB v2) hard-codes the horizontal blanking interval to exactly 80 pixels, increasing pixel clock precision to ±0.001MHz. CVT-RB v3 further refines this architecture by aligning with Adaptive-Sync protocols and restricting the vertical front porch to exactly 3 lines. Reducing these non-active pixel periods is the primary mechanism for lowering the interface DOTCLK below the logic board’s failure threshold. Reference: 1, 2, 3
Execution: How to Overclock Monitor Refresh Rate
Execution requires strict adherence to bandwidth constraints and an absolute verification of cable integrity. The physical link layer cannot be ignored.
The DisplayPort 1.4a specification supports a maximum total bandwidth of 32.4 Gbps (HBR3), yielding a usable data rate of exactly 25.92 Gbps after factoring in 8b/10b encoding overhead. If the target resolution and the newly overclocked refresh rate exceed this strict limit, the signal will outright fail unless Display Stream Compression (DSC 1.2)—a visually lossless 3:1 ratio compression algorithm—is natively supported and activated.
Furthermore, extreme signal attenuation over cheap, unshielded cables routinely destroys high-frequency link training. If a DisplayPort cable lacks proper internal shielding, the high voltage swings required for a 165Hz differential signal will rapidly degrade over the copper trace.
Advanced GPU drivers and PHY controllers allow manipulation of DisplayPort “Voltage Swing” and “Pre-Emphasis” parameters. A pre-emphasis level of 2 or 3 adds a transient electrical boost to high-frequency signals, intentionally over-driving the transition edges to combat inter-symbol interference (ISI) across the cable, often stabilizing an otherwise jittery, stuttering overclock.
- Prerequisite 1: Verify DisplayPort 1.4a or HDMI 2.1 cable VESA certification to rule out physical layer attenuation.
- Prerequisite 2: Calculate total interface bandwidth to ensure the target refresh rate does not exceed the HBR3 or UHBR10 physical limits.
- Prerequisite 3: Ensure the host GPU drivers (NVIDIA or AMD Adrenalin) are completely updated to access raw EDID overrides and prevent link training loops.
Hardware Expectations: 60Hz vs. 144Hz Monitors
User expectations must perfectly align with semiconductor realities. The methodology and probability of success change radically depending on the starting hardware tier.
| Hardware Base | Target OC | Success Rate | Engineering Constraint |
| 60Hz IPS/TN Panel | 72Hz – 75Hz | ~90% | Highly successful. Standard scalers are natively designed to handle 75Hz for legacy VESA compatibility. |
| 60Hz VA Panel | 80Hz – 90Hz | ~40% | Moderate. VA pixel transition times (Grey-to-Grey) often smear and trail before the scaler actually fails. |
| 144Hz Gaming Panel | 160Hz – 165Hz | ~15% | Very Low. TCONs in this bracket are heavily binned and saturated at the 144Hz factory limit. |
| 240Hz Esports Panel | 270Hz+ | <5% | Practically impossible without factory unlocking due to extreme bandwidth limits and severe thermal generation. |
Aggregate data compiled from exhaustive testing and hardware enthusiast forums (such as Blur Busters and Overclock.net) confirms that budget 60Hz panels are the prime candidates for aggressive timing manipulation. High-end 144Hz and 240Hz displays fail almost immediately when pushed past their specifications, as the manufacturers have already utilized aggressive Overdrive (OD) voltages to extract the absolute maximum operational frequency from the matrix.
Method 1: Advanced Tuning via Custom Resolution Utility (CRU)
Power users and display engineers avoid native GPU control panels entirely. They prefer to edit the monitor’s Extended Display Identification Data (EDID) at the exact OS registry level using the Custom Resolution Utility (CRU). This completely bypasses artificial driver restrictions and directly modifies the handshake data.
- Deploy the Utility: Execute CRU as a system administrator to access the active display registry blocks.
- Target the Detailed Resolutions Block: This is the primary block the OS reads to define native pixel behavior. The first detailed resolution dictates the preferred native format. Click “Add” under this specific Detailed Resolutions section.
- Apply LCD Reduced Timings: In the timing parameter dropdown, select “Automatic – LCD reduced”. This is the single most critical engineering step. It forces the horizontal and vertical blanking porches to absolute minimums (often dictating a 0 back porch), drastically reducing the geometry and keeping the DOTCLK safely under the TCON’s crash threshold.
- Increment the Refresh Rate: Input the target refresh rate (e.g., 75Hz) directly into the frequency box. The utility will automatically calculate the required pixel clock.
- Save and Restart the Graphics Subsystem: Click OK, and execute the restart64.exe application included in the CRU directory. This flushes and restarts the GPU display driver without requiring a full system reboot, instantly applying the new EDID override to the registry.
- Validate in Windows: Navigate to the Windows Advanced Display Settings menu and select the newly injected refresh rate from the adapter properties dropdown.
Method 2: Native Tuning via NVIDIA & AMD Radeon Settings
For an accessible, immediate workflow without third-party registry editing, custom resolution profiles can be forced directly through the native GPU command centers.
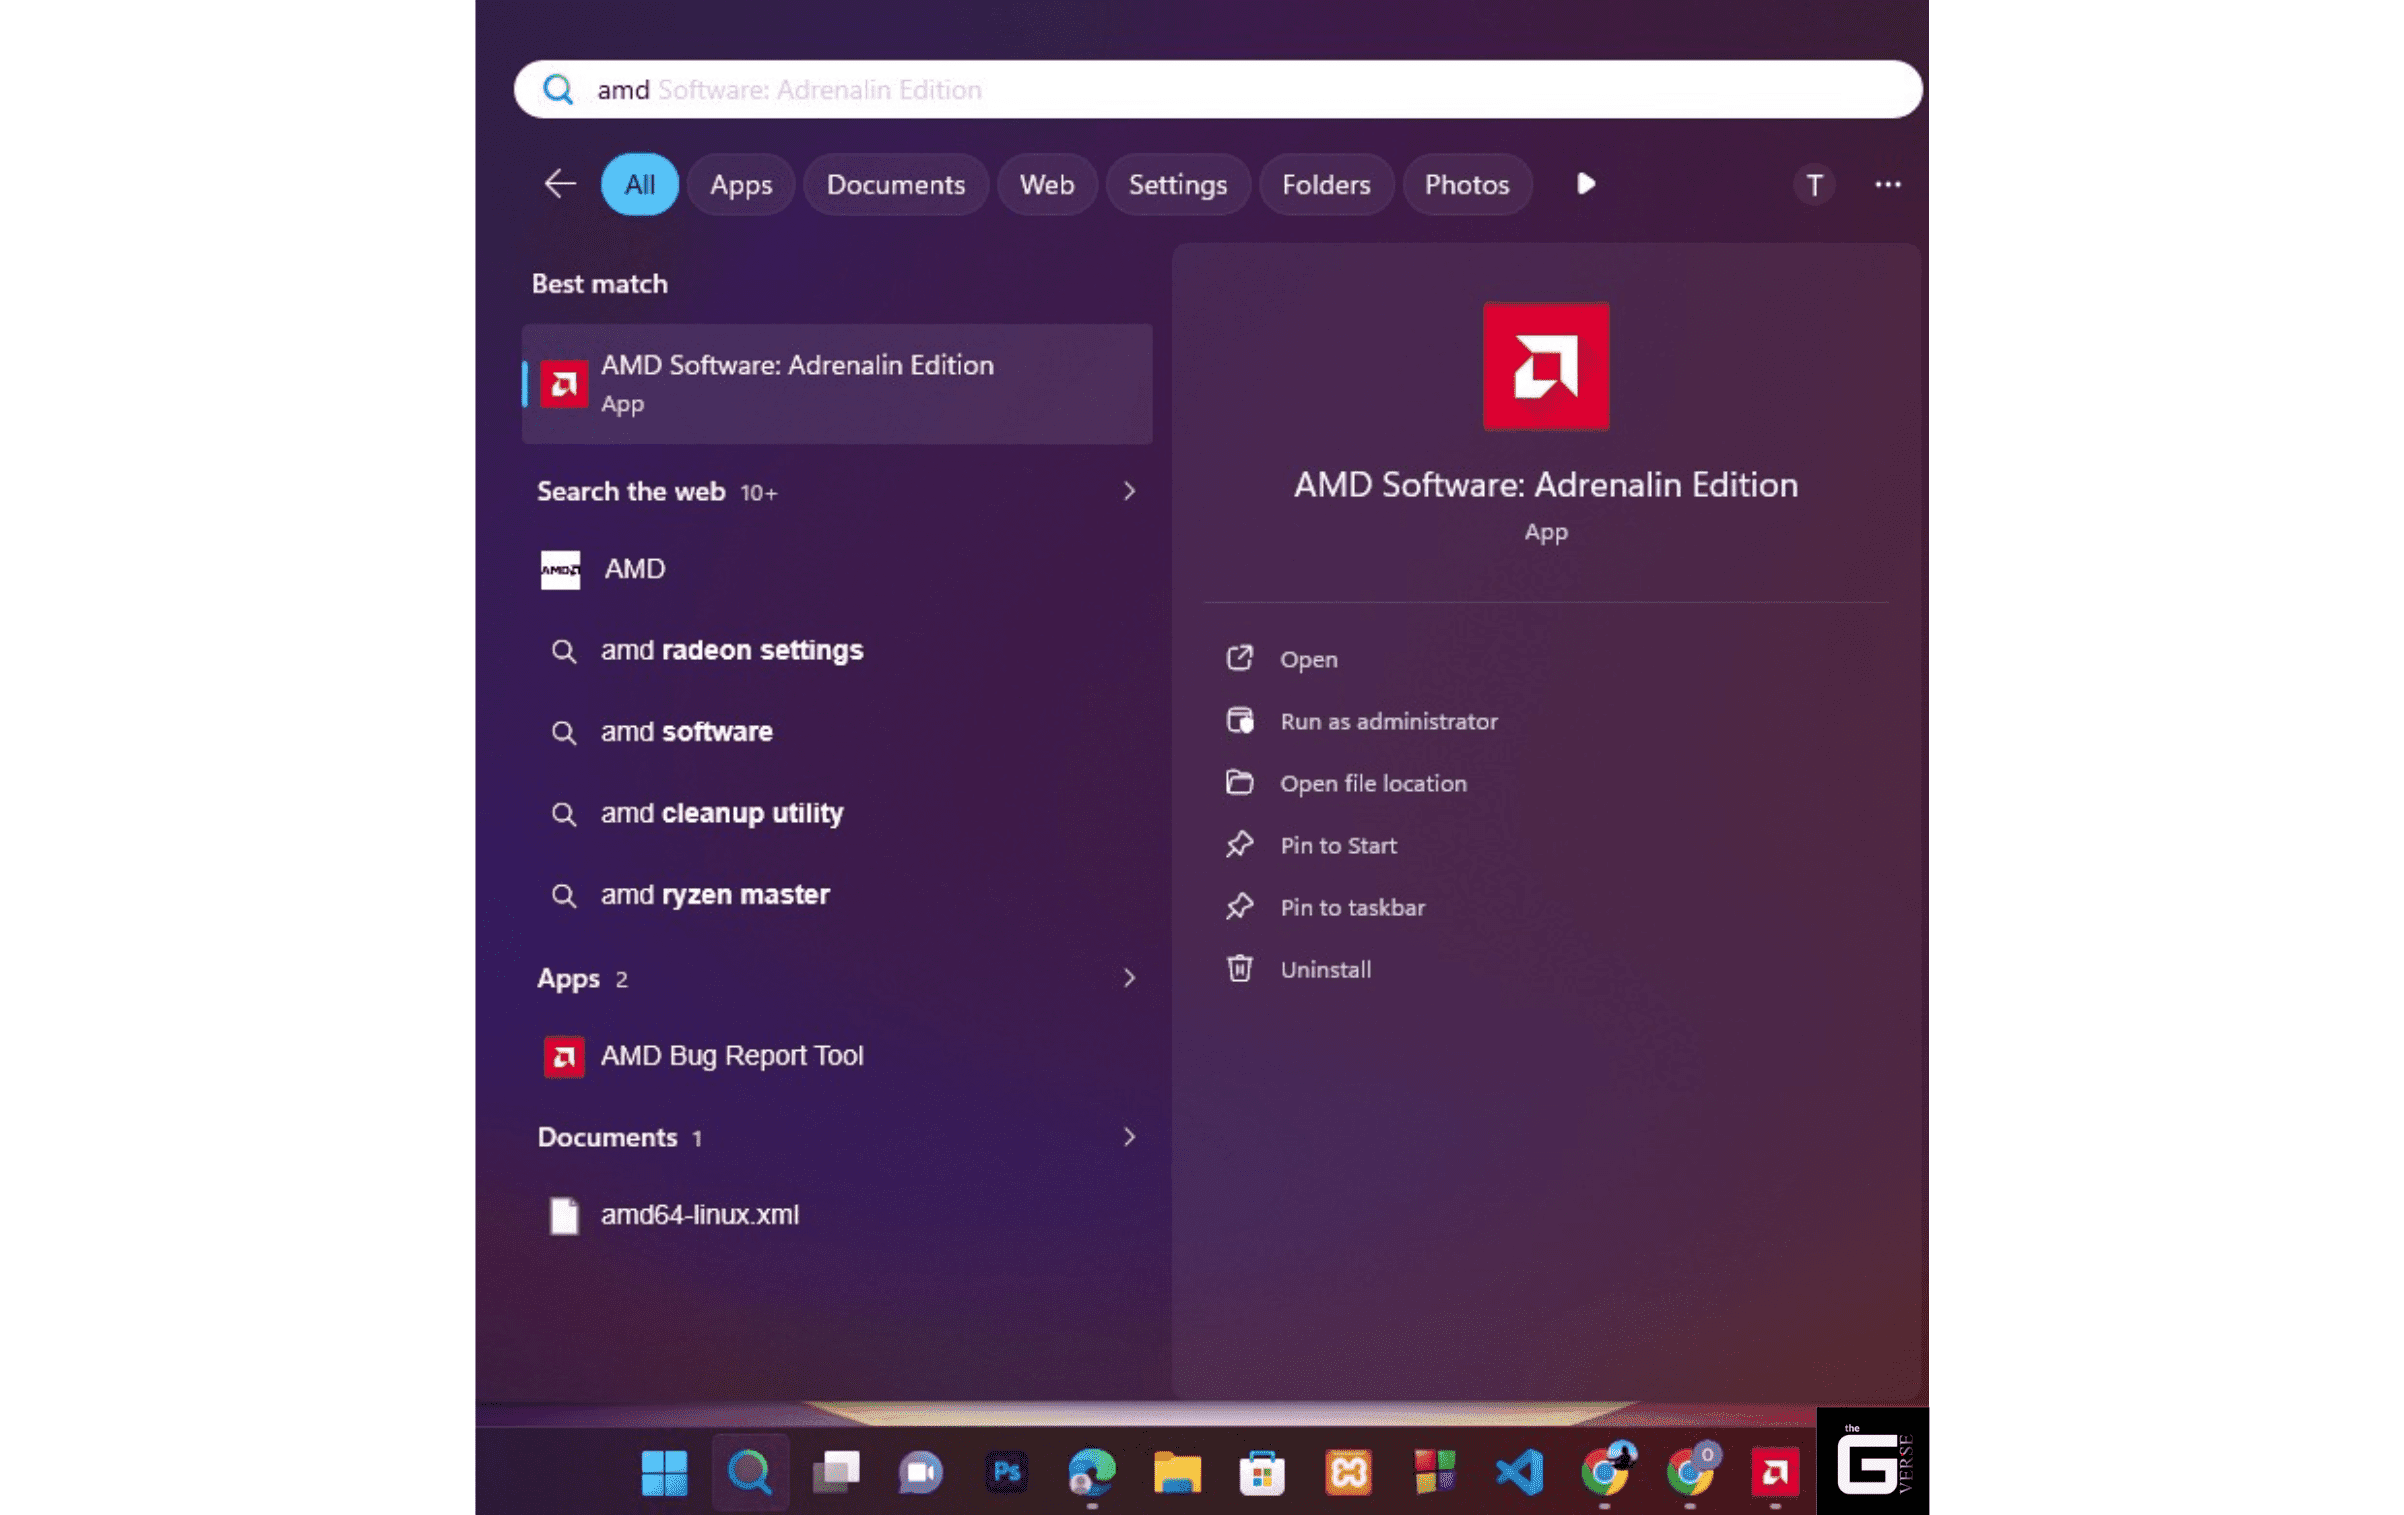
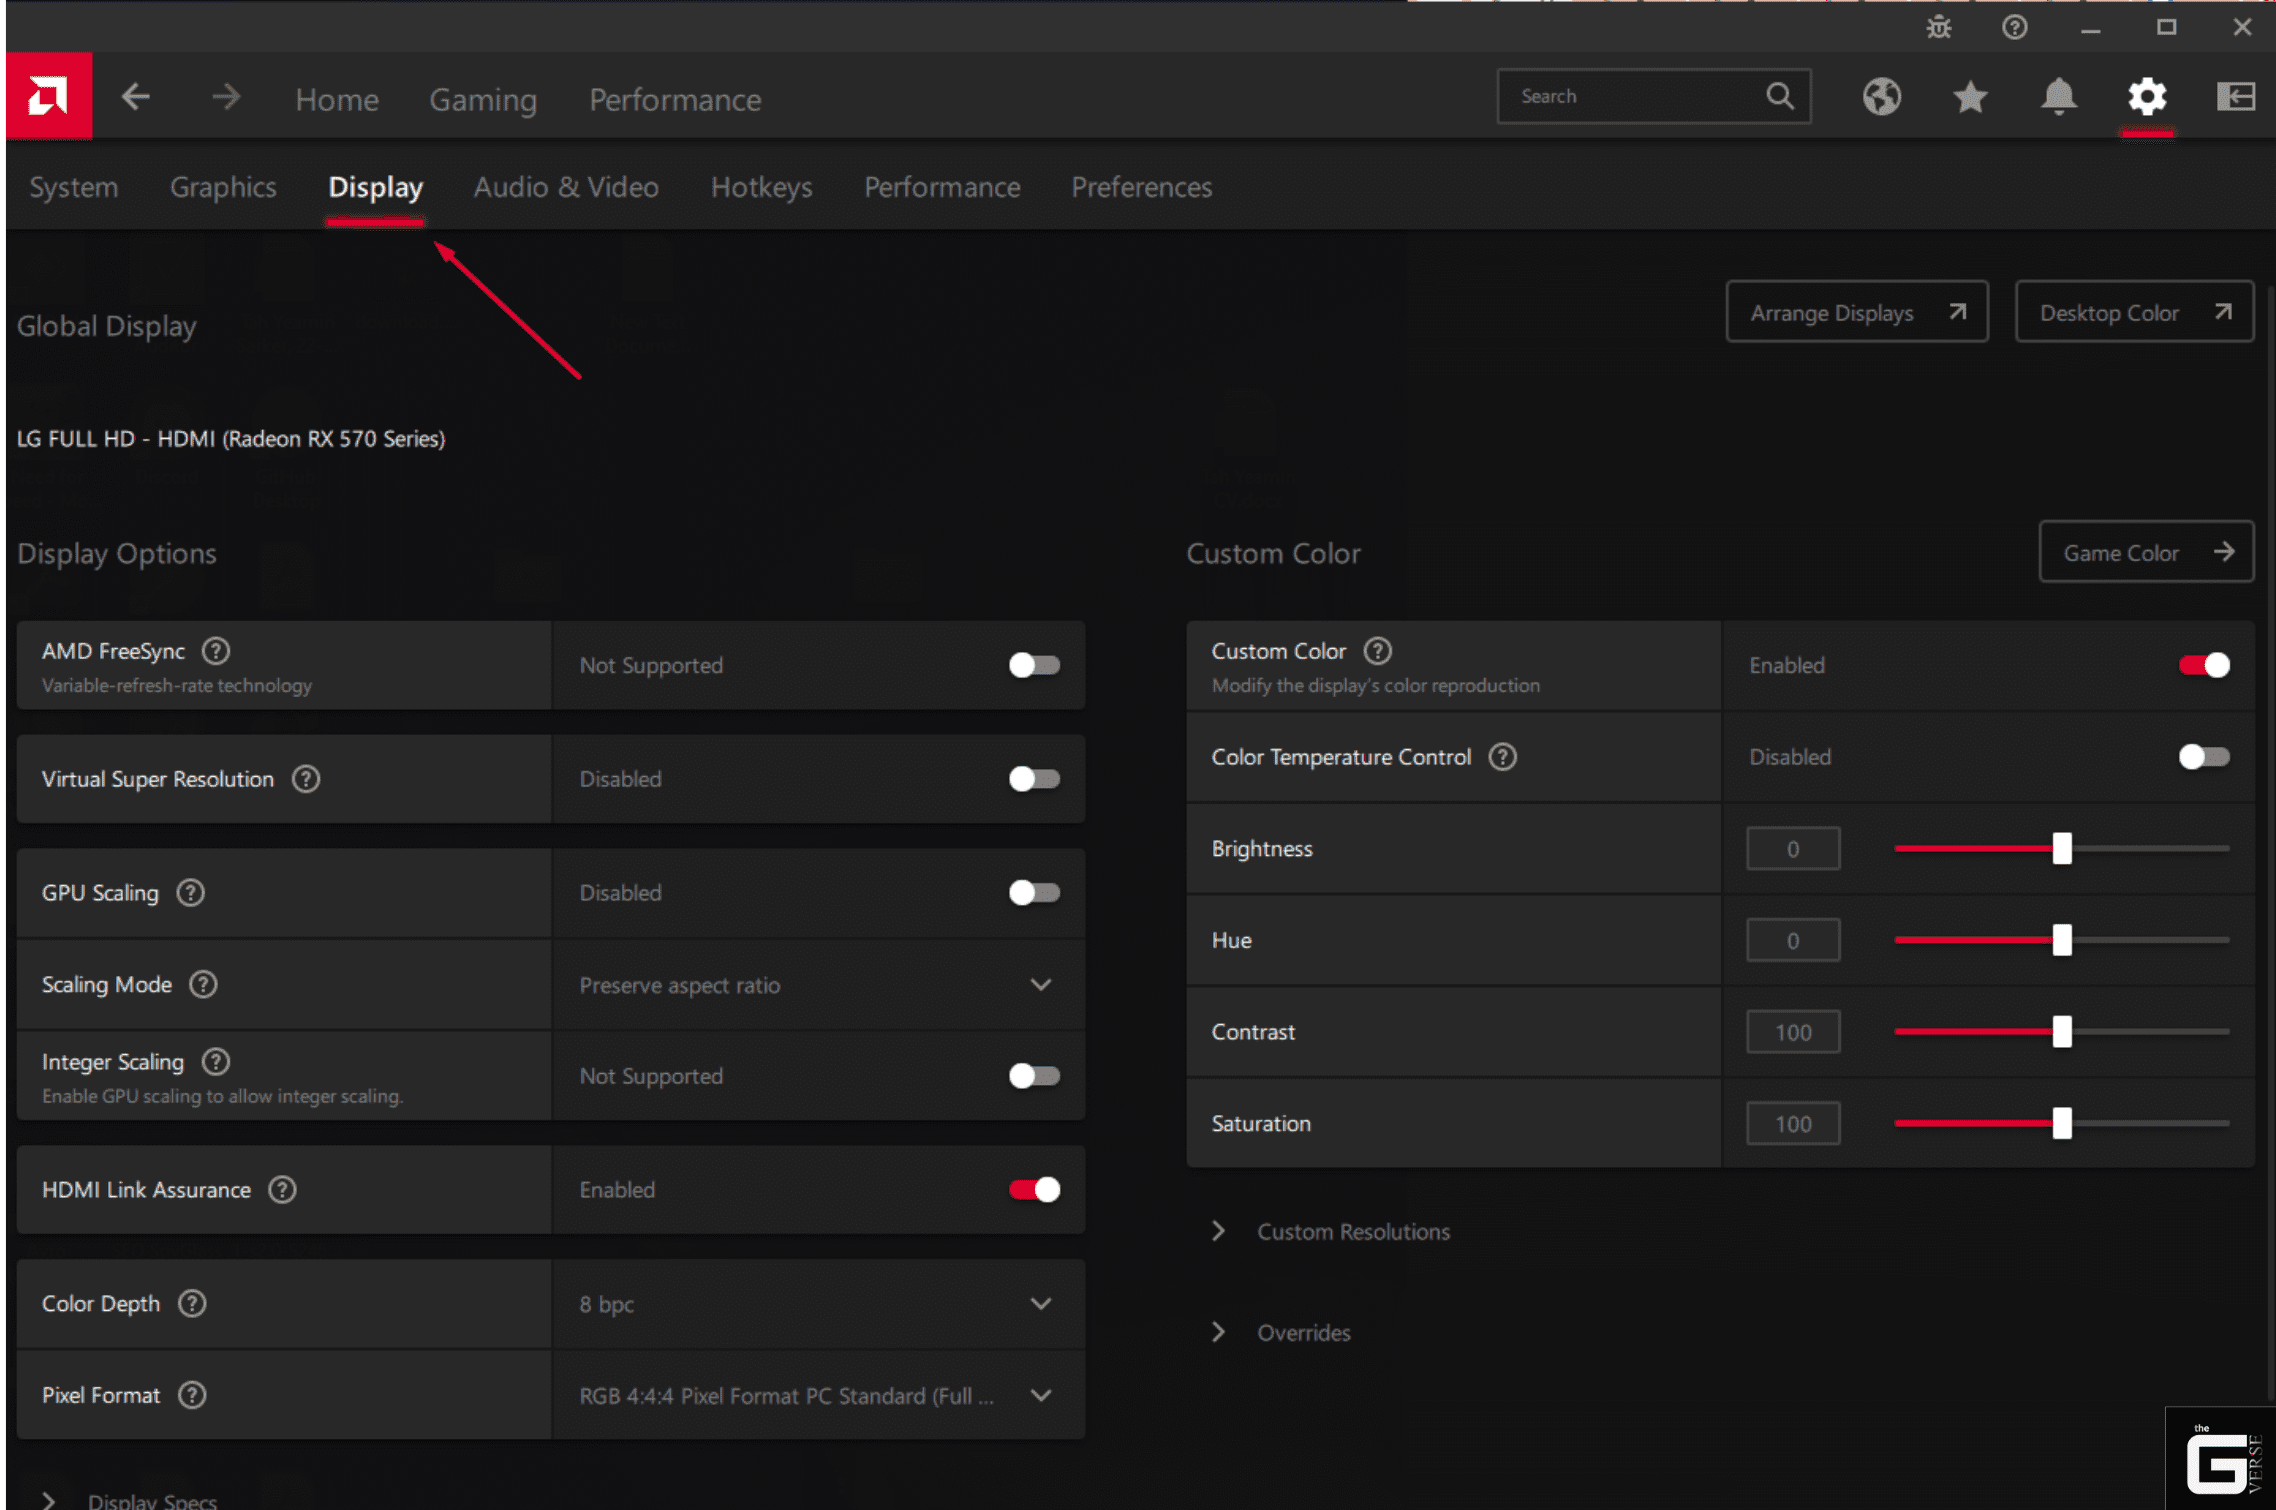
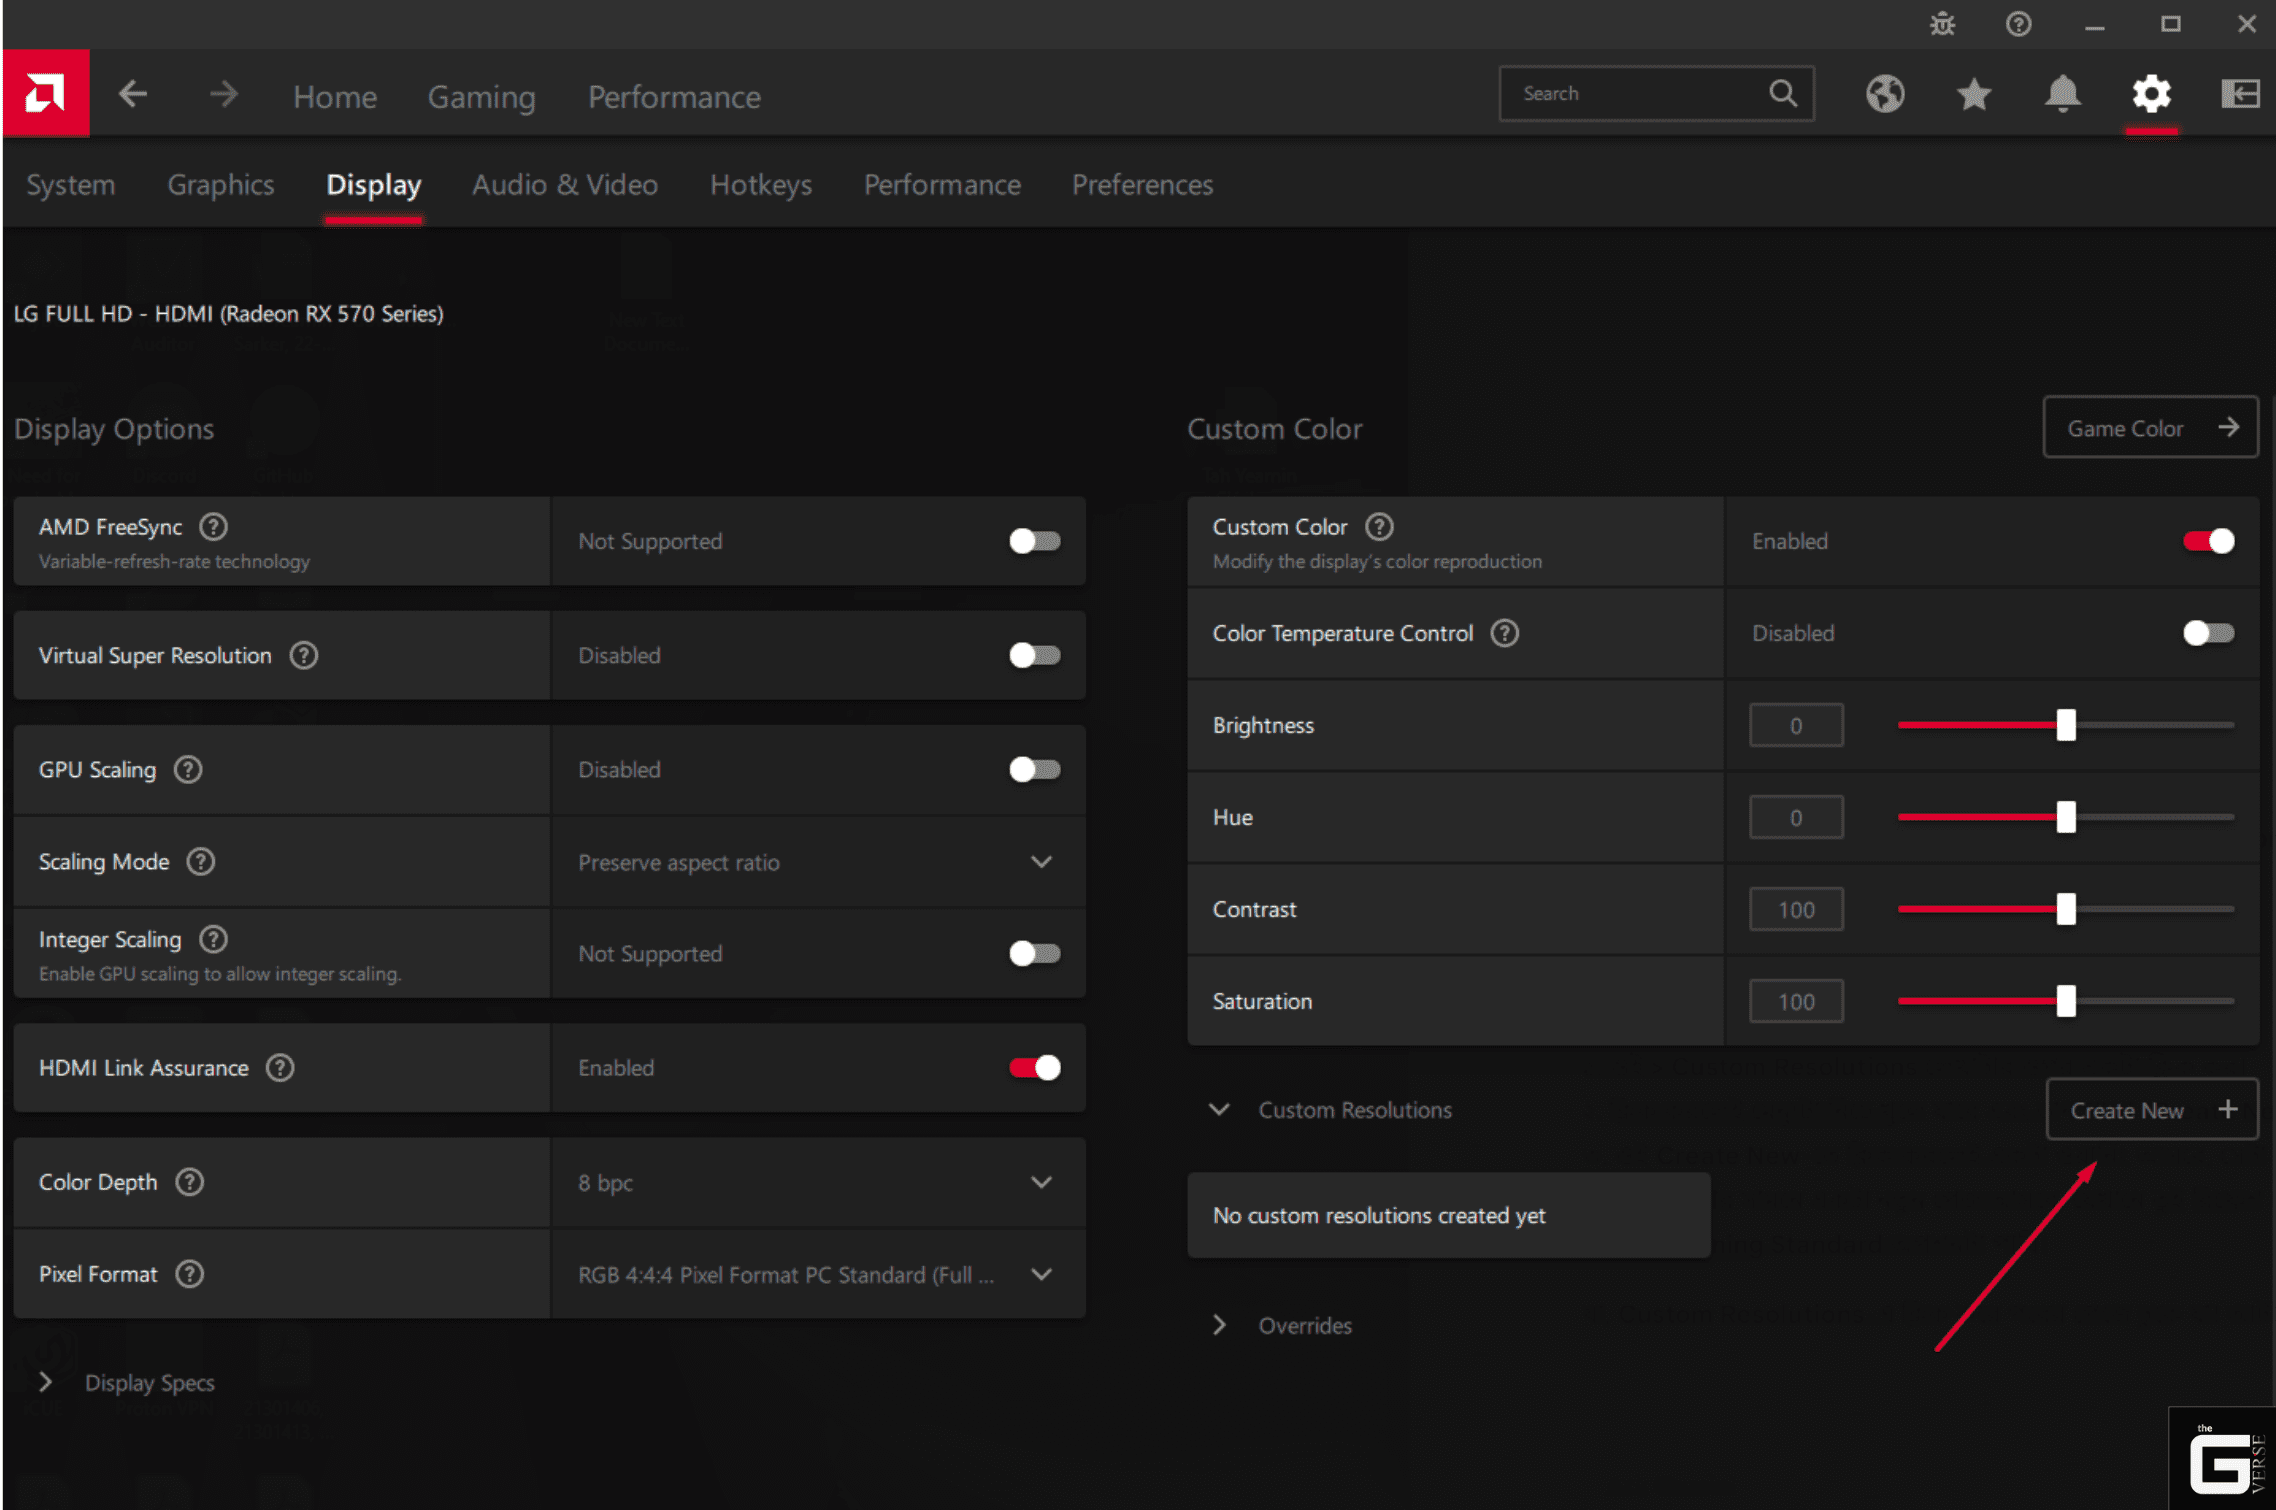
- Access the Control Panel: Open the NVIDIA Control Panel or AMD Software: Adrenalin Edition.
- Create Custom Resolution: Navigate to “Change Resolution” -> “Customize” (NVIDIA) or “Gaming -> Display -> Custom Resolutions -> Create New” (AMD).
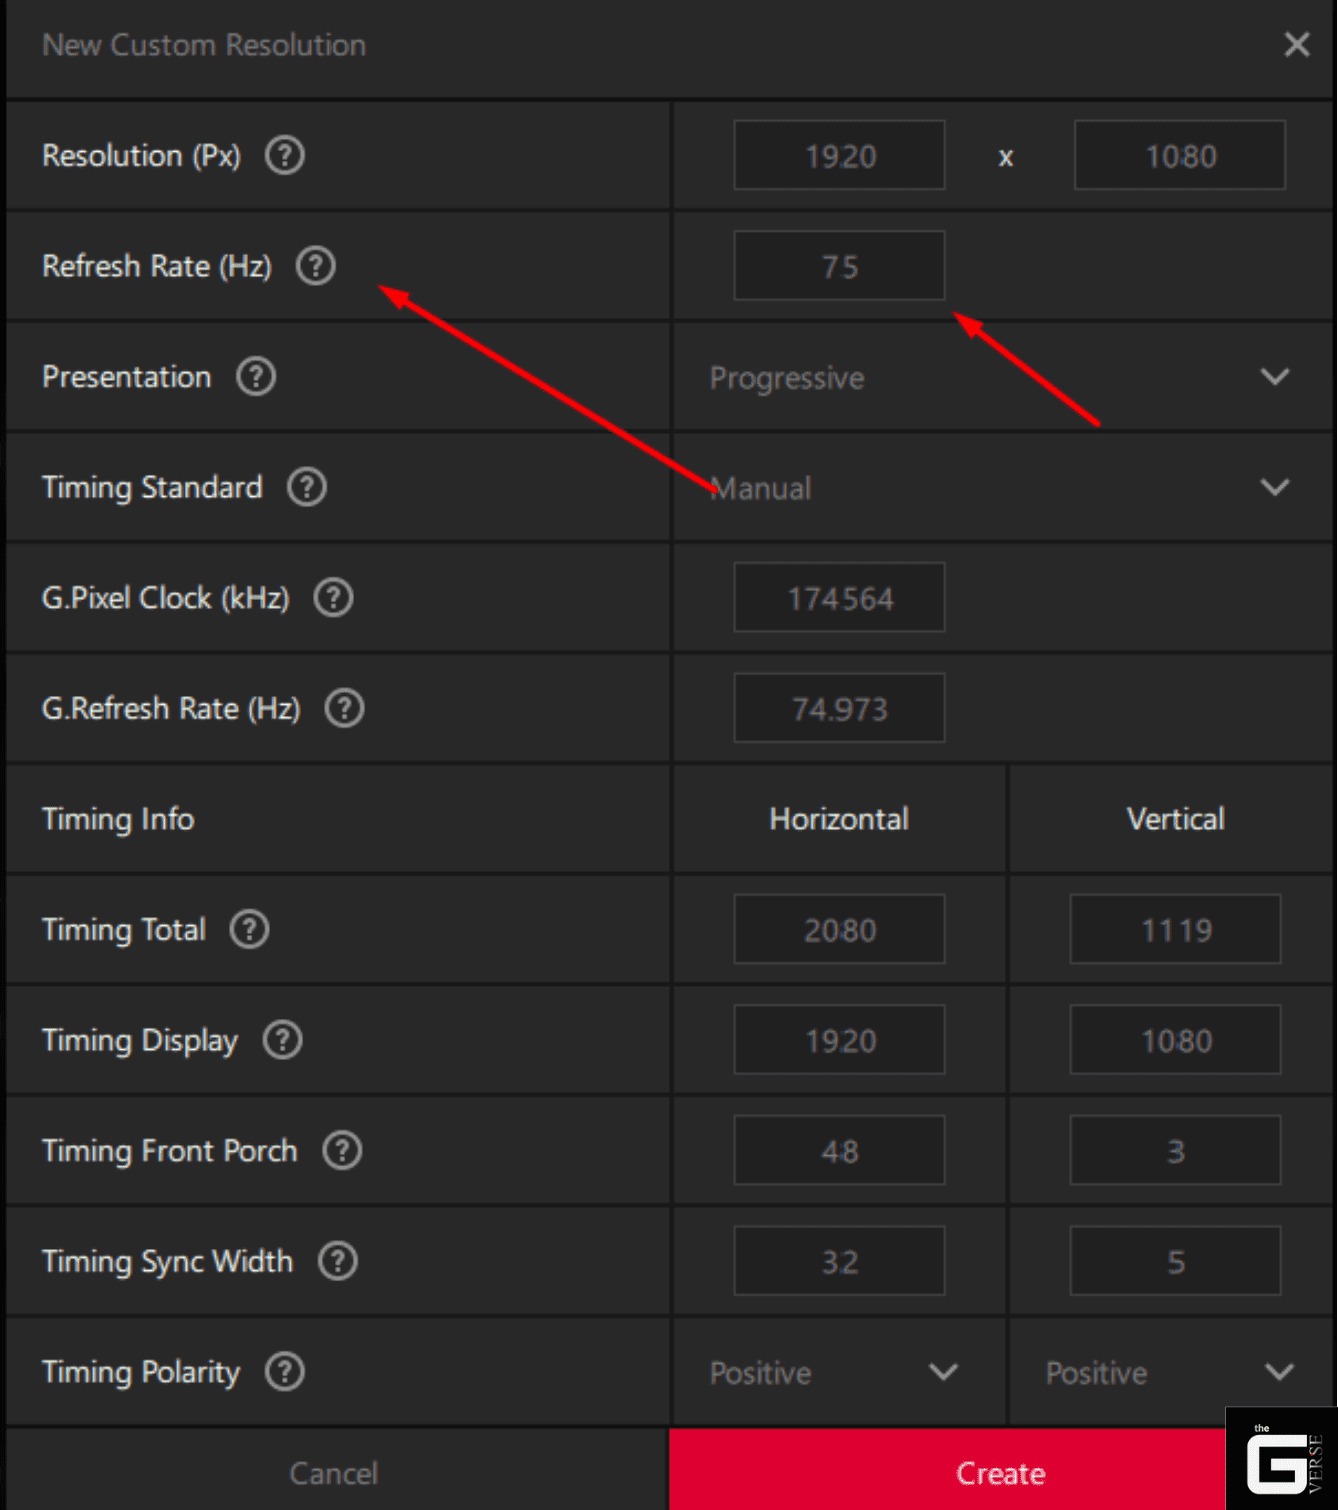
- Adjust Timing Standards: Change the timing standard from the default “Automatic” to “CVT Reduced Blanking” (NVIDIA) or “CVT-RB” (AMD) to shrink the signal overhead.
- The 1Hz Stepping Method: Increase the refresh rate by exactly 1Hz at a time. Click “Test.”
- Monitor for Signal Degradation: If the monitor successfully displays the image for the 15-second test window without flickering, color inversion, or going black, accept the resolution.
- Find the Floor: Repeat this rigorous 1Hz stepping until the monitor definitively displays an “Out of Range” error or drops the link completely. Once physical failure occurs, revert to the last stable configuration and drop the frequency by an additional 2Hz to guarantee thermal stability under load.
Best Refresh Rate and Overclocking Tips for Gamers
Pushing a monitor past its rated specification is entirely useless if the resulting gameplay is compromised by visual tearing, erratic frame pacing, or dropped packets.
- Always Validate Frame Pacing: Never assume a successfully displayed desktop equals a true overclock. The monitor must be physically tested to ensure the logic board is actually rendering the extra frames sequentially.
- Cap Your Framerate Natively: Utilize tools like RTSS (RivaTuner Statistics Server) to cap the 3D engine framerate at exactly 1 FPS below the new overclocked refresh rate (e.g., cap at 74 FPS for a 75Hz overclock). This prevents the render queue from overflowing and triggering V-Sync latency.
- Leverage Adaptive Sync: Ensure G-Sync or FreeSync remains active. If the EDID override breaks the FreeSync negotiation, use CRU’s CEA-861 Extension Block editor to manually expand the Variable Refresh Rate (VRR) data block to encompass the newly established overclocked ceiling.
- Monitor Display Temperatures: Physically touch the back panel near the DisplayPort/HDMI I/O cluster after an hour of load. If the TCON area becomes painfully hot to the touch, the overclock is placing excessive voltage stress on the logic board. Back down the refresh rate immediately.
Troubleshooting Your Overclock: Artifacts & Stutters
The most pervasive and insidious issue in monitor tuning is the phenomenon of the “fake” overclock. In this scenario, the user inputs 100Hz into CRU, the screen flashes, the desktop reappears, and the Windows display adapter proudly reports the monitor is running at 100Hz.
However, the mouse cursor feels heavy, and severe micro-stutters emerge during rapid 3D camera panning. The underlying architecture has failed silently.
The TCON accepted the high-frequency 100Hz signal, but its internal processing buffer lacks the required bandwidth to actually draw 100 complete frames per second onto the liquid crystal matrix. As a survival mechanism to prevent a total crash, the scaler quietly drops 40 frames out of the 100, rendering a jittery, visually broken 60Hz while continuing to report a valid 100Hz link to the host operating system.
Validating Stability and Eliminating Frame Skipping
Objective, forensic validation is absolutely mandatory. The physics of frame skipping dictates that standard software overlay metrics (like FRAPS, MSI Afterburner, or the NVIDIA overlay) will not detect a dropped frame because the host GPU is successfully rendering and transmitting it.
The failure happens downstream, completely isolated inside the monitor’s logic board. To objectively prove an unbroken continuous frame chain, the Blur Busters TestUFO frame-skipping test must be utilized alongside precise slow-shutter photography.
- Load the Test UFO Tool: Navigate to the specific frame-skipping URL. The screen will display a fast-moving sequence of solid white blocks traversing against a static black grid.
- Configure Camera Settings: Utilize a smartphone camera equipped with a “Pro” or “Manual” mode. Adjust the shutter speed to exactly 1/10th of a second.
- Capture the Movement: Take a physical photograph of the moving blocks while the camera tracks the movement (pursuit camera setup) or remains static.
- Analyze the Sequence: An unbroken, solid, continuous trail of white squares proves a legitimate, true overclock. If the photograph reveals gaps, black spaces, or broken squares in the light trail, the monitor’s scaler is physically skipping frames. The overclock is entirely fake and must be discarded.
The Science / Research Insight: According to Blur Busters motion blur analysis, frame skipping is a mechanical failure of sample-and-hold display persistence. Minimum Moving Picture Response Time (MPRT) dictates that when a scaler drops a frame, the liquid crystal matrix holds the previous state for double the intended duration (13.33ms x 2 = 26.66ms). This massive temporal discrepancy violently breaks the stroboscopic effect of finite framerate displays, resulting in severe human-perceivable judder that destroys motion clarity.
Recovering from Black Screens and “Out of Range” Errors
Pushing the pixel clock past the monitor’s absolute hardware limits guarantees an immediate signal failure. The screen will go completely black, or a floating OSD box will appear declaring “Out of Range” or “Input Not Supported”. If the graphics driver does not automatically revert the resolution after the standard 15-second timeout window, emergency system recovery is required.
- Forced Reboot: Hard reset the machine using the physical chassis button. If the OS boots but the screen goes black immediately upon loading the Windows login screen, the overclocked EDID has been permanently applied to the active registry profile.
- Engage Safe Mode: Boot Windows into Safe Mode (interrupt the boot sequence three times or hold Shift while clicking Restart). Safe Mode bypasses the dedicated GPU driver and loads the basic Microsoft Display Adapter, completely ignoring the overclocked registry EDID override.
- Purge the Registry: Navigate directly to the CRU software directory and execute reset-all.exe as an administrator. This executes a highly specific script that parses the Windows registry tree and violently strips all modified EDID profiles and display overrides.
- Reboot to Normalcy: Restart the computer normally. The monitor will default to its safe, factory-certified 60Hz timing parameters.
Is Monitor Overclocking Safe? Thermal Degradation & Hardware Realities
The analysis of physical hardware risks centers squarely on the Timing Controller (TCON) integrated circuit and the surrounding power delivery capacitor array. Running a display panel at a higher frequency inherently increases the voltage switching rate across the logic board.
The unalterable physical consequence of increased semiconductor switching is a direct elevation in thermal output. Standard consumer LCD logic boards are engineered with razor-thin, highly cost-optimized thermal dissipation budgets.
Pushing a 60Hz panel to 75Hz continuously forces the transistors and the associated power delivery phases to process 25% more data every single second. Without active cooling or heavy aluminum heatsinks on the logic board, this heat pools around the surface-mount capacitors and the bare TCON silicon package, inducing severe thermal stress.
Does Overclocking a Monitor Reduce Lifespan?
The hardware reality is rigidly defined by semiconductor physics, specifically advanced thermal degradation modeling. Elevated temperatures exponentially accelerate electromigration and material fatigue within the integrated circuits.
- The 10-Degree Rule: In logic board reliability testing, the “10-degree rule” is universally applied to aluminum electrolytic capacitors. It dictates that the operational lifespan of a capacitor strictly halves for every 10°C increase in ambient operating temperature. Therefore, if an overclock elevates internal chassis thermals by just ten degrees, the power delivery components will fail in half the intended time.
- TCON Junction Stress: If the TCON junction temperature rises from a safe 70°C to 85°C under an aggressive 165Hz overclock, the logic board’s mean time between failures (MTBF) shrinks significantly. The frequency factor and reaction rate constants shift, leading to inevitable component degradation.
- OLED Differential Aging: In OLED and QD-OLED panels, refresh rate overclocking presents a profoundly distinct physical risk. Pushing the refresh rate higher drives higher sustained electrical current through the individual organic light-emitting diodes, elevating localized heat. This excess heat drastically accelerates differential aging across the subpixels, commonly resulting in rapid, permanent burn-in or completely dead pixels causing permanent black spots on your display.
The Science / Research Insight: The thermal degradation and lifespan reduction of semiconductor components is mathematically quantified by the Arrhenius equation. In logic board reliability models, assuming an activation energy ($E_a$) of 1.05eV and utilizing Boltzmann’s constant ($8.617 \times 10^{-5} eV/K$), even minor continuous temperature spikes in the TCON logic due to high-frequency voltage switching yield an acceleration factor ($AF$) that exponentially degrades the die’s silicon longevity over years of sustained use.
Monitor Overclocking Warranty Void: Fact vs. Forensic Fiction
Pervasive anxieties regarding voided warranties dominate hardware enthusiast circles. The central fear is forensic detection: Can a manufacturer actively detect if a monitor was destroyed by a custom refresh rate overclock during a Return Merchandise Authorization (RMA) analysis?
The forensic reality is a definitive no. When EDID tuning is applied via CRU or a native GPU control panel, the modified configuration is strictly software-based. The custom display profile resides solely within the host Operating System’s Windows Registry. It is injected into the graphics pipeline during the OS boot sequence.
The software never flashes or permanently rewrites the monitor’s internal non-volatile Read-Only Memory (EEPROM). Furthermore, standard consumer LCD TCONs and scalar chips completely lack diagnostic logging capabilities.
There is no internal NAND flash memory recording an error log of “Out of Range” events, nor is there a telemetry system recording peak DOTCLK frequencies. If a monitor fails due to thermal fatigue induced by an overclock and is sent in for an RMA, the technicians pulling the logic board have absolutely zero forensic data indicating the panel was run out of specification. The warranty remains functionally intact, as the physical failure appears indistinguishable from standard, spontaneous hardware fatigue.
The Final Verdict: Is it Worth Your Time?
Frankly, the assumption that strict factory specifications represent the true, absolute capability of display hardware is a deeply flawed premise. The display manufacturing industry relentlessly segments silicon for profit, leaving vast amounts of temporal performance locked firmly behind artificial software barriers.
Let’s be real. For the average 60Hz monitor—whether an aging IPS office display or a budget gaming TN panel—overclocking to 75Hz remains one of the single most efficient, cost-effective hardware tweaks available in modern computing. The precision mathematics of VESA CVT-RB v3 timings allow bandwidth limits to be elegantly bypassed, while utilities like CRU democratize access to core OS-level registry modifications.
However, user expectations must be ruthlessly checked against semiconductor physics. Attempting to force a heavily binned 144Hz panel to 165Hz will almost certainly result in saturated TCON buffers, dropped frames, and severe human-perceivable judder, negating any perceived temporal advantage.
Validate every profile rigorously with slow-shutter photography, monitor the physical hardware for severe thermal spikes, and enjoy the immediate, tangible reduction in input latency that comes from unlocking the panel’s true engineered capabilities.